You have a Fabric workspace named Workspace1 that contains two Power BI reports named Report1 and Report2.
You create a workspace app that contains both reports.
You need to ensure that the app meets the following requirements:
• Report1 must be visible to all the users in your organization.
• Report2 must be visible to only a security group named Group1.
What should you do next?
A. Assign Group1 the Viewer role for Workspace1.
B. Create an audience and assign Group1 to the audience.
C. Allow access to the hidden content of the app.
D. Share Report1 with the built-in All users security group.
Show Answer
Correct Answer: B
Explanation: Use app audiences to control which users can see specific content within a single Power BI/Fabric app. Configure one audience for everyone in the organization that includes Report1, and another audience for Group1 that includes Report2 (and optionally Report1 if Group1 should also see it). Workspace Viewer permissions apply to the entire workspace, sharing a report bypasses app content targeting, and hidden content settings do not provide group-based visibility control.
Question 36
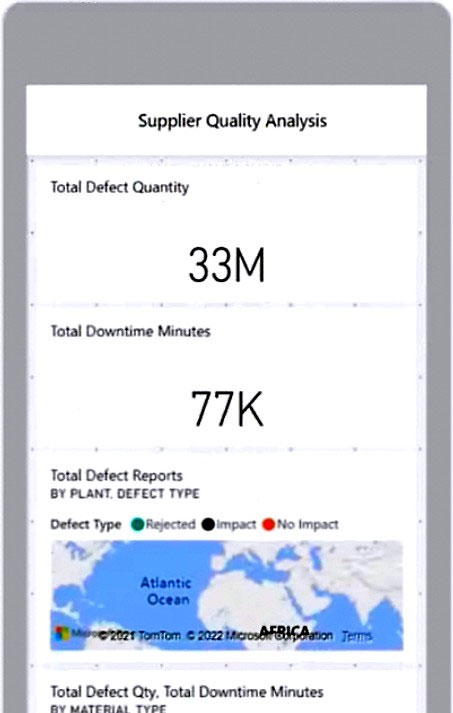
You maintain a Power BI workspace that contains a supplier quality dashboard. The dashboard contains 10 card visuals, two map visuals and five bar chart visuals.
The dashboard mobile layout is shown in the exhibit. (Click the Exhibit tab.)
You need to modify the dashboard mobile layout to meet the following requirements:
✑ Only show single-value visuals.
✑ Minimize scrolling.
What should you do?
A. Decrease the size of the card visuals. Remove the map and bar chart visuals.
B. Decrease the size of the map and bar chart visuals. Move all the card visuals to the top of the layout.
C. Remove the card visuals. Increase the size of the map and bar chart visuals.
D. Move the bar chart visuals to the top of the layout. Remove the map visuals. Decrease the size of the card visuals.
Show Answer
Correct Answer: A
Explanation: Cards display single values, while maps and bar charts show multiple data points. Remove the map and bar chart visuals to meet the single-value requirement, then reduce the card sizes to fit more of them on the mobile layout and minimize scrolling.
Question 37
HOTSPOT
-
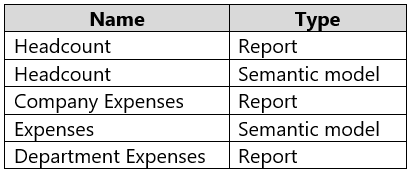
You have a Fabric workspace that contains the items shown in the following table.
You need to make content available to the management department and the accounting department at your company. The solution must meet the following requirements:
• The management department must have view access to the Headcount and Department Expenses reports.
• The management department must NOT be able to view any other current or future reports.
• The management department must NOT be able to build new reports by using the semantic models.
• The accounting department must only be able to view the Company Expenses report.
• The accounting department must be able to build new reports by using the Expenses semantic model.
The solution must follow the principle of least privilege and minimize administrative effort.
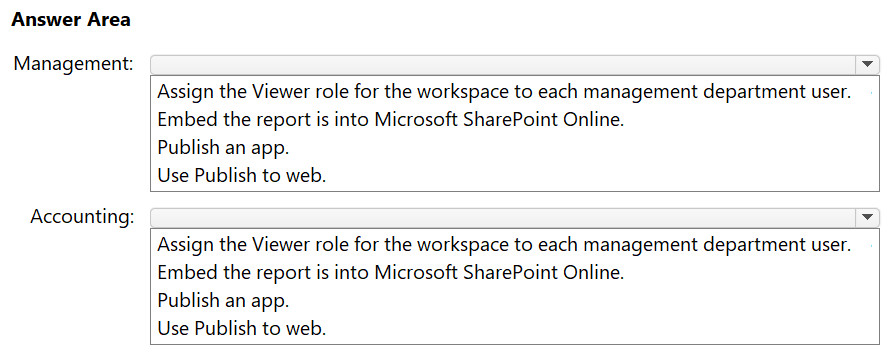
How should you make the content available to the users in each department? To answer, select the appropriate options in the answer area.
NOTE: Each collect selection is worth one point.
Show Answer
Correct Answer: Management: Publish an app
Accounting: Publish an app
Explanation: Apps let you include only selected reports, preventing access to other current/future reports. For management, do not grant Build permissions. For accounting, include only Company Expenses and enable Build permission on the Expenses semantic model in the app.
Question 37
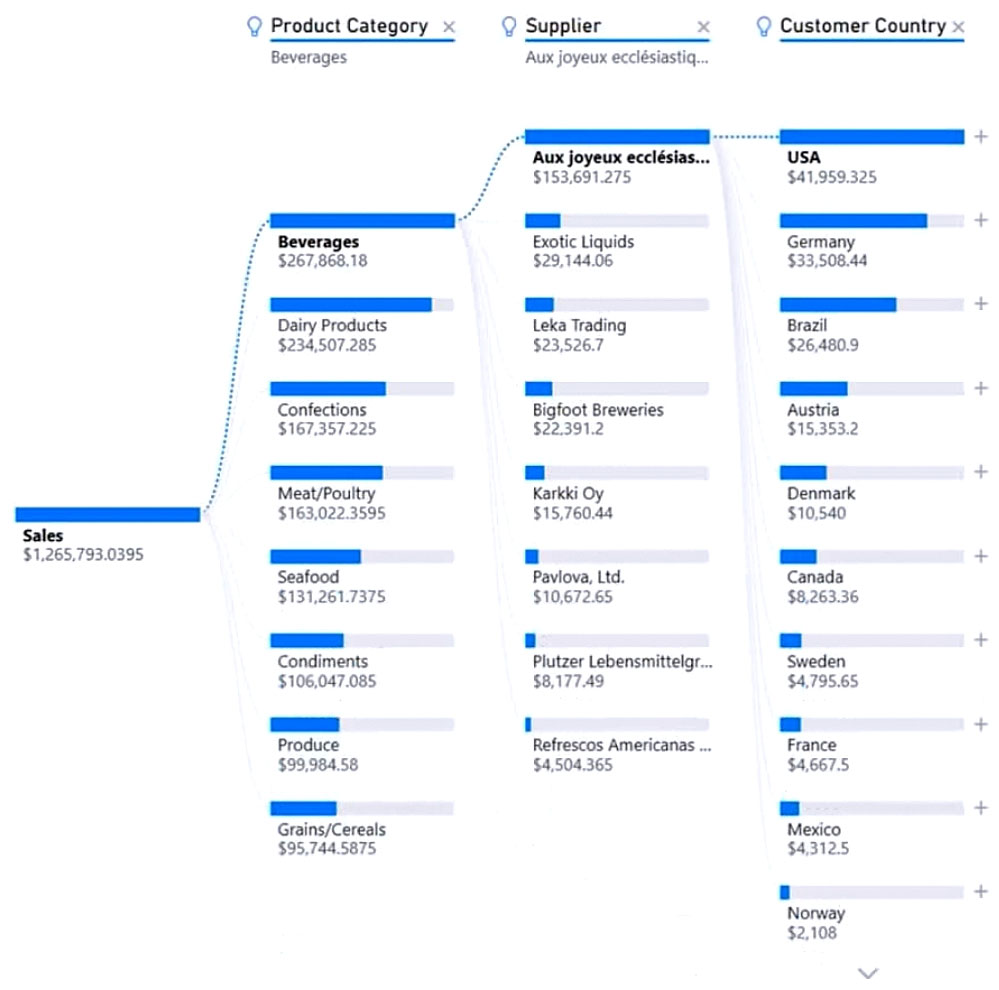
You need to create a visual that enables the adhoc exploration of data as shown in the following exhibit.
Which type of visual should you use?
A. smart narrative
B. decomposition tree
C. Q&A
D. key influencers
Show Answer
Correct Answer: B
Explanation: Use a decomposition tree. It supports ad hoc exploration by letting users split a measure (such as Sales) by different fields and expand the resulting branches interactively.
Question 38
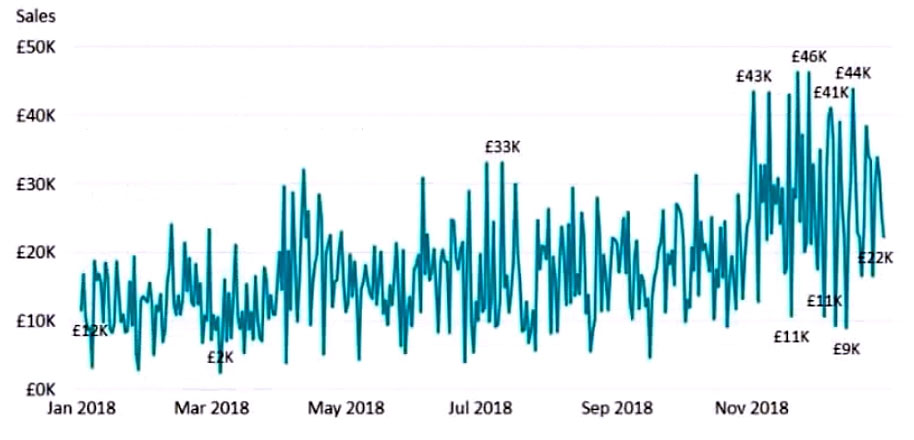
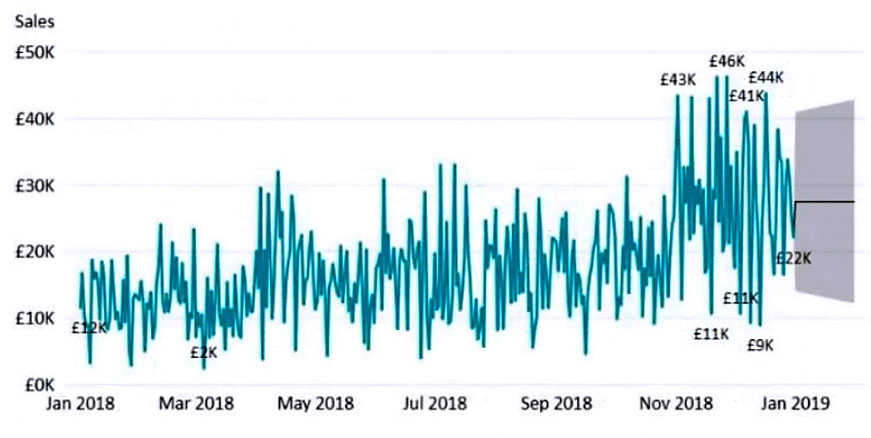
You have the visual shown in the Original exhibit. (Click the Original tab.)
You need to configure the visual as shown in the Modified exhibit. (Click the Modified tab.)
What should you add to the visual?
A. a measure
B. an Average line
C. a trendline
D. a forecast
Show Answer
Correct Answer: D
Explanation: Add a forecast. The modified visual extends beyond the existing sales data and shows a projected value with a shaded confidence interval for the future period.
Question 38
HOTSPOT
-
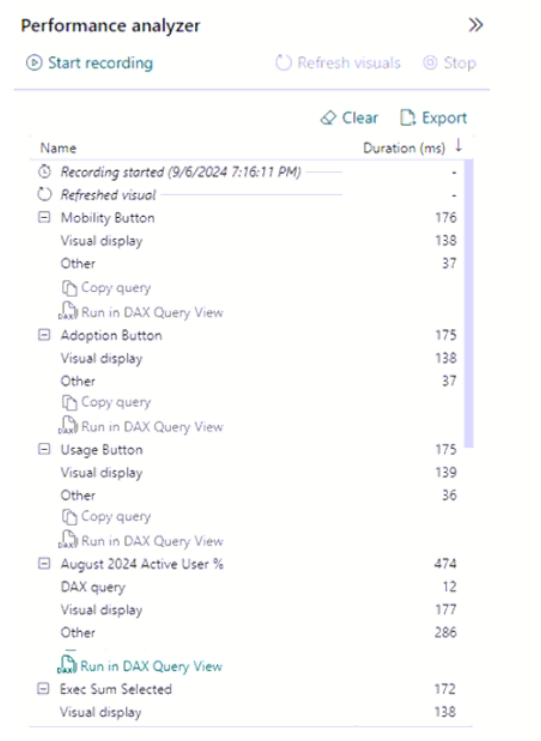
You have the Performance analyzer results shown in the following exhibit.
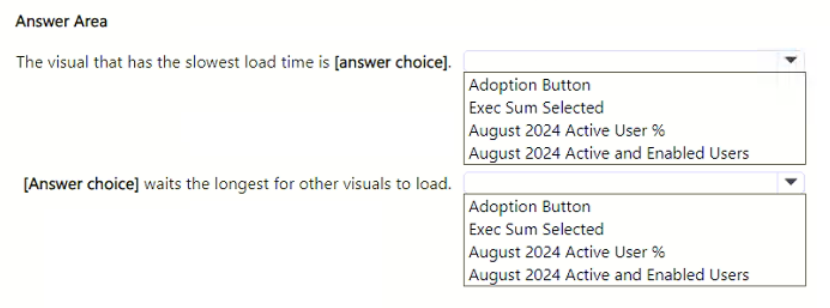
Use the drop-down menus to select the answer choice that completes each statement based on the information presented in the graphic.
NOTE: Each correct selection is worth one point.
Show Answer
Correct Answer: August 2024 Active User %
August 2024 Active User %
Explanation: The slowest visual is the one with the highest total duration. 'August 2024 Active User %' has the highest total duration (474 ms). Its 'Other' time (286 ms) is also the largest, and 'Other' represents time spent waiting for other visuals/background processing.
Question 39
You are creating a Power BI report that will contain multiple visuals.
You need to ensure that the report is accessible to users who use a screen reader.
Which two configurations should you perform? Each correct answer presents part of the solution.
NOTE: Each correct selection is worth one point.
A. consistent fonts for each visual
B. alt text for each visual
C. the tab order for each page
D. consistent colors for each visual
E. Play Axis for each page
Show Answer
Correct Answer: B, C
Explanation: For Power BI accessibility, provide alternative (alt) text for visuals so screen readers can describe them, and configure the tab order on each report page so keyboard and screen reader users navigate visuals in a logical sequence. Consistent fonts and colors can improve usability but are not the specific screen reader accessibility configurations, and Play Axis is unrelated.
Question 39
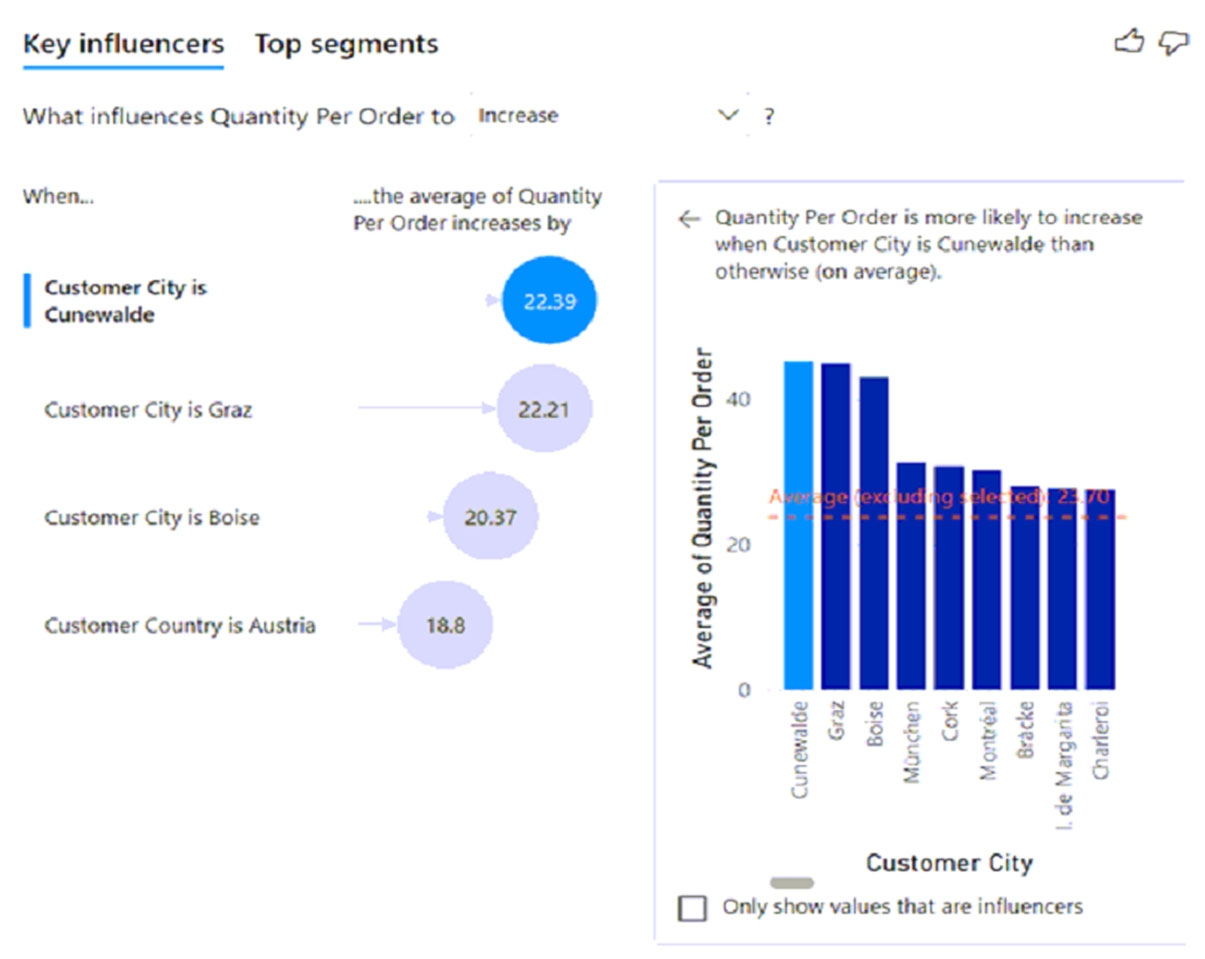
You are using the key influencers visual to identify which factors affect the quantity of items sold in an order.
You add the following fields to the Explain By field:
✑ Customer Country
✑ Product Category
✑ Supplier Country
✑ Sales Employee
✑ Supplier Name
✑ Product Name
✑ Customer City
The key influencers visual returns the results shown in the following exhibit.
What can you identify from the visual?
A. Customers in Austria order 18.8 more units than the average order quantity.
B. Customers in Boise order 20.37 percent more than the average order quantity.
C. Product Category positively influences the quantity per order.
D. Customers in Cork order lower quantities than average.
Show Answer
Correct Answer: A
Explanation: The visual states that when Customer Country is Austria, the average Quantity Per Order increases by 18.8. This is an increase in units, not a percentage; Boise’s 20.37 is also an absolute increase. Cork’s bar is above the displayed average, and Product Category is not shown as an identified influencer.
Question 40
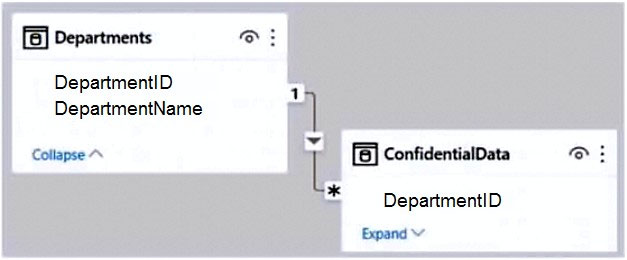
You have the Power BI model shown in the following exhibit.
There are four departments in the Departments table.
You need to ensure that users can see the data of their respective department only.
What should you do?
A. Create a slicer that filters Departments based on DepartmentID.
B. Create a row-level security (RLS) role for each department, and then define the membership of the role.
C. Create a DepartmentID parameter to filter the Departments table.
D. To the ConfidentialData table, add a calculated measure that uses the CURRENTGROUP DAX function.
Show Answer
Correct Answer: B
Explanation: Create a row-level security role for each department and assign the appropriate users to each role. Filtering the Departments table by DepartmentID will propagate through the relationship to ConfidentialData, restricting each user to their department’s rows.
Question 40
You are creating a visual in a Power BI report. The associated semantic model contains sales from the last four years for three products.
You need to display the total sales by quarter categorized by product. The visual must display trends in both total sales and individual product sales.
Which type of visual should you use?
A. area chart
B. clustered column chart
C. stacked area chart
D. line chart
Show Answer
Correct Answer: C
Explanation: A stacked area chart is designed to show trends over time while also showing the contribution of each category to the total. With quarter on the time axis and product as the legend, it displays both the overall sales trend (top boundary of the stacked areas) and the individual product sales contributions over time. A line chart shows trends well but does not inherently display the cumulative total and category composition in the same way.
$19
Get all 371 questions with detailed answers and explanations
Instant download HTML + PDF delivered the moment payment clears.
Secure Stripe checkout we never see or store your card details.
7-day refund if files are defective see our refund policy.