DRAG DROP
-
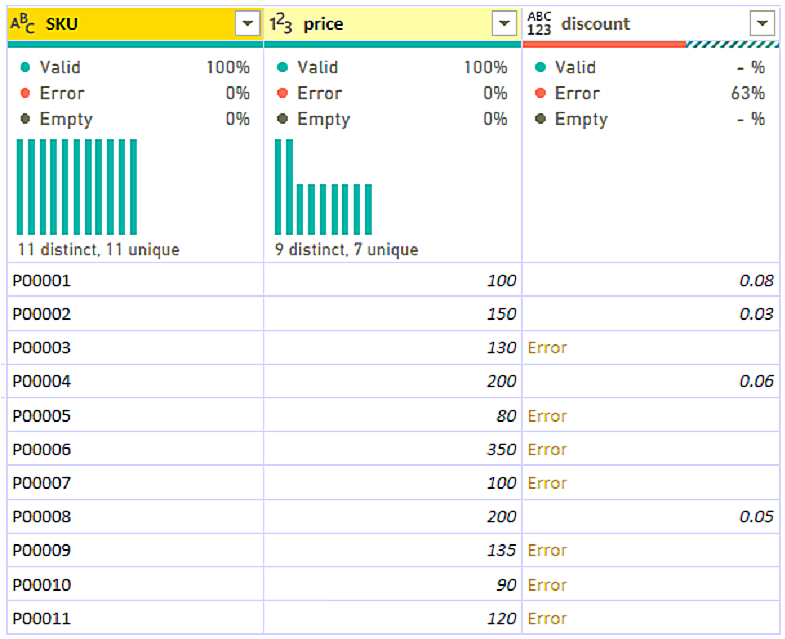
You use Power Query Editor to preview the data shown in the following exhibit.
You need to clean and transform the query so that all the rows of data are maintained, and error values in the discount column are replaced with a discount of 0.05. The solution must minimize administrative effort.
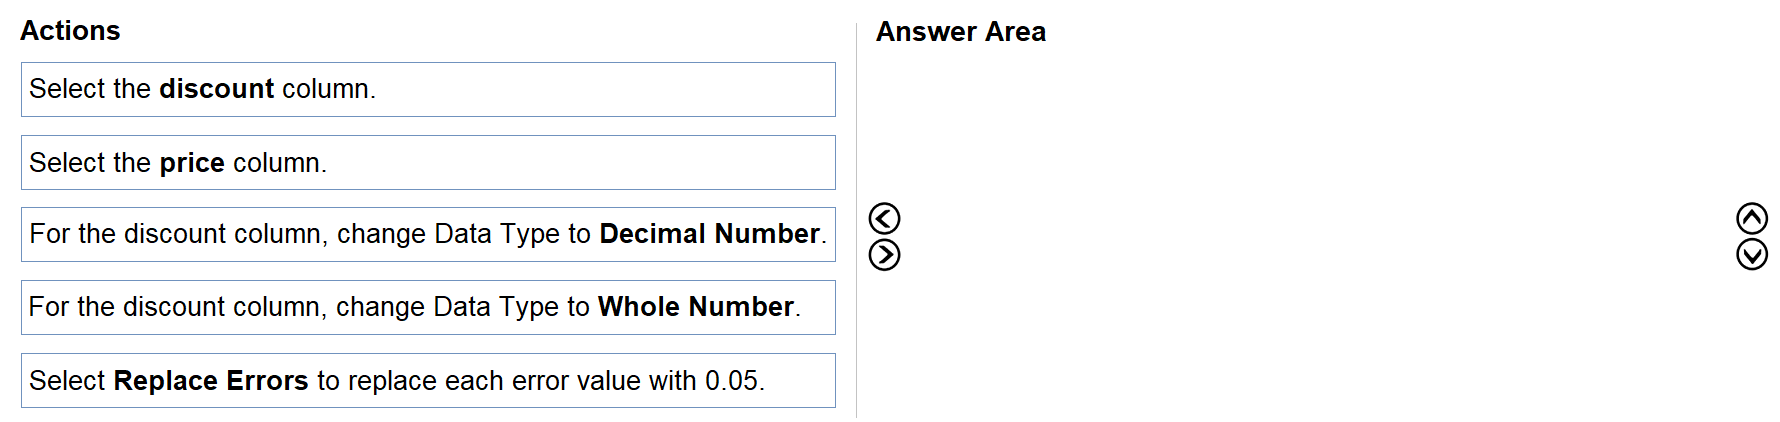
Which three actions should you perform in sequence? To answer, move the appropriate actions from the list of actions to the answer area and arrange them in the correct order.
Show Answer
Correct Answer: 1. Select the discount column.
2. Select Replace Errors and enter 0.05.
3. Change the discount column’s data type to Decimal Number.
Explanation: Replacing errors preserves every row. Decimal Number supports the fractional discount values, including 0.05.
Question 10
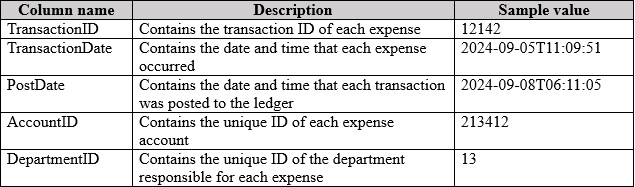
You have a Power BI query named Expenses that imports the following data.
Users only use the date portion of the TransactionDate value when performing data analysis.
You need to minimize the model size without affecting the analysis.
Which two actions should you perform? Each correct answer presents part of the solution.
NOTE: Each correct selection is worth one point.
A. Change the data type of the TransactionDate column to Date.
B. Change the data type of the PostDate column to Date.
C. Remove the PostDate column.
D. Remove the TransactionID column.
Show Answer
Correct Answer: A, C
Explanation: Convert TransactionDate to Date because its time portion is not used. Remove PostDate because the analysis uses the transaction date rather than the ledger posting date; removing an unused column reduces model size.
Question 11
You are creating a dashboard by using the Power BI service.
You have an existing report page that contains three charts.
You need to add the charts to the dashboard while maintaining the interactivity between the charts.
What should you do?
A. Edit interactions in the report and set all interactions to Filter.
B. Pin each chart as a tile.
C. Edit the dashboard theme and pin each chart as a tile.
D. Pin the report page as a live tile.
Show Answer
Correct Answer: D
Explanation: To preserve cross-visual interactivity, pin the entire report page as a live tile. Individually pinned visuals become dashboard tiles and do not maintain the report's cross-filtering and cross-highlighting behavior. A live report page tile retains the report's interactive experience within the dashboard.
Question 11
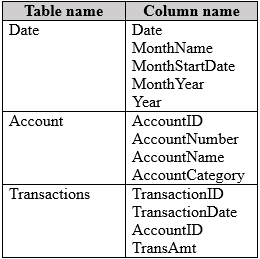
You have a Power BI semantic model that contains the following data.
You need to create a solution that meets the following requirements:
• Presents transaction amount totals for each month for the current and prior year
• Follows the star schema modeling approach
• Minimizes the data model size
Which three actions should you perform? Each correct answer presents part of the solution.
NOTE: Each correct selection is worth one point.
A. Create one-to-many relationships between the tables.
B. In the Transactions query, delete the TransactionID column.
C. In the Date query, group by MonthNumber.
D. In the Transactions query, group by AccountID and MonthStartDate for TransactionDate. Aggregate by summing the TransAmt column.
E. In the Transactions query, add a column that contains the MonthStartDate value for TransactionDate.
F. Create many-to-many relationships between the tables.
Show Answer
Correct Answer: A, D, E
Explanation: Add a MonthStartDate column derived from TransactionDate, then group the Transactions table by AccountID and MonthStartDate and sum TransAmt. This pre-aggregates the fact table to the required monthly grain and removes unneeded detail columns, including TransactionID, reducing model size. Create one-to-many relationships from the Date and Account dimension tables to the aggregated Transactions table, preserving the star schema and enabling current-versus-prior-year reporting.
Question 11
You have a semantic model that uses a live connection to a semantic model in the Power BI service.
You need to create a Power BI report named RPT1 that only uses the live connection.
Which three components can you add to RPT1? Each correct answer presents a complete solution.
NOTE: Each correct selection is worth one point.
A. a report measure
B. a calculated column
C. a calculated table
D. a new column
E. a new table
Show Answer
Correct Answer: A
Explanation: With a live connection to a Power BI semantic model, the report cannot modify the underlying model by adding tables or columns. Calculated columns, calculated tables, new columns, and new tables are not supported. You can create report measures, which are stored with the report rather than the connected semantic model.
Question 12
HOTSPOT
-
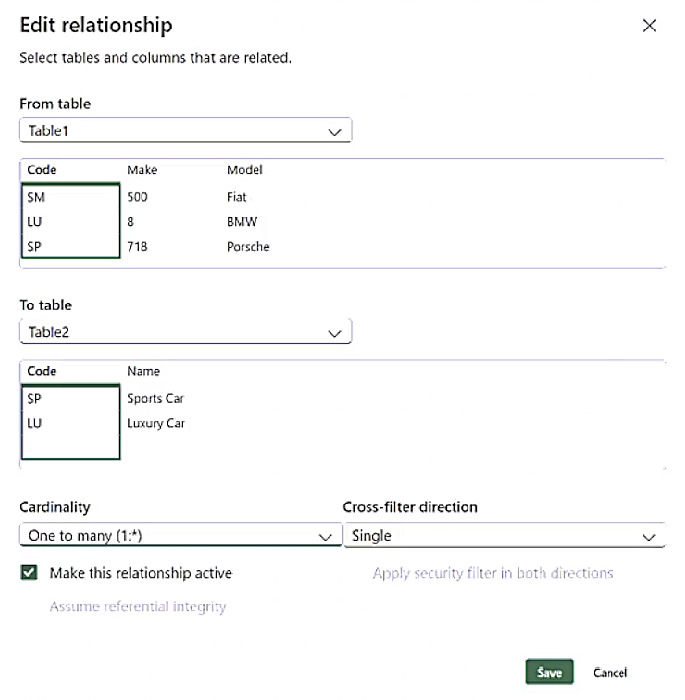
You have a Power BI report with the Edit relationship page open as shown in the following exhibit.
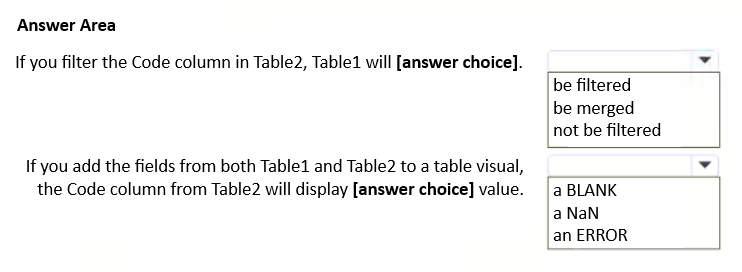
Use the drop-down menus to select the answer choice that completes each statement based on the information presented in the graphic.
NOTE: Each correct selection is worth one point.
Show Answer
Correct Answer: not be filtered
a BLANK
Explanation: The relationship is one-to-many (Table2 is the one side, Table1 the many side) with single cross-filter direction, so filters flow from Table2 to Table1 only if the arrow is from one to many? In Power BI, single direction flows from the one side to the many side. Here Table2 contains unique codes (LU, SP) while Table1 has an unmatched SM. Filtering Table2 does not include unmatched values, and when combining fields from both tables, the unmatched SM row shows a blank value from Table2.
Question 12
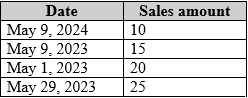
You have a Power BI semantic model named Model1 that contains two tables named DimDate and FactSales. There is an active relationship between DimDate and FactSales. DimDate is marked as the date table. FactSales contains the following data.
Model1 contains the following measure.
Previous Year Sales = CALCULATE([Sales Amount], PREVIOUSYEAR('Date'[Date]))
You have a report that uses Model1. The report has a single report page that has a page level filter set to May 9, 2024. The result of the Previous Year Sales measure is displayed in a card visual.
Which value will appear in the card visual?
A. 10
B. 15
C. 35
D. 60
Show Answer
Correct Answer: D
Explanation: PREVIOUSYEAR returns all dates in the previous calendar year, based on the last date in the current context. With May 9, 2024 selected, it filters FactSales to dates in 2023. The 2023 sales total is 15 + 20 + 25 = 60.
Question 13
DRAG DROP -
You have a Power BI data model that contains two tables named Products and Sales.
A one-to-many relationship exists between the tables.
You have a report that contains a report-level filter for Products.
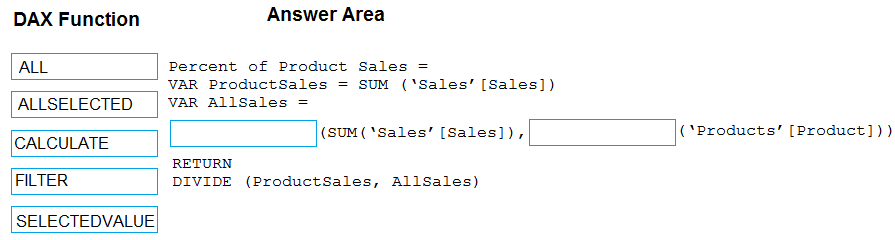
You need to create a measure that will return the percent of total sales for each product. The measure must respect the report-level filter when calculating the total.
How should you complete the DAX measure? To answer, drag the appropriate DAX functions to the correct targets. Each function may be used once, more than once, or not at all. You may need to drag the split bar between panes or scroll to view content.
NOTE: Each correct selection is worth one point.
Show Answer
Correct Answer: 1. CALCULATE
2. ALLSELECTED
Explanation: CALCULATE evaluates total sales with the per-product visual filter removed. ALLSELECTED('Products'[Product]) retains the report-level Products filter, so the denominator includes only the selected products.
Question 13
You plan to create a Power BI report that will be connected to multiple data sources. One of the data sources contains tax records.
You need to ensure that other queries cannot access the tax record information.
To what should you set Privacy Level for the data source?
A. None
B. Organizational
C. Private
D. Public
Show Answer
Correct Answer: C
Explanation: Set the data source Privacy Level to Private. In Power Query, a Private source is isolated from other data sources to prevent data from being shared or leaked during query evaluation, merges, or query folding. This is the appropriate setting for sensitive tax records.
Question 13
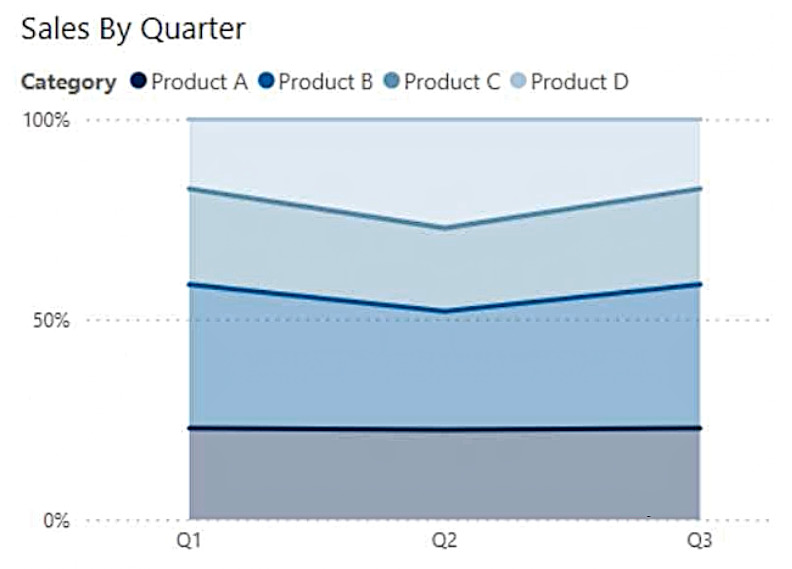
You have a Power BI semantic model named Model1 that contains two fields named Sales and Quarter. Model1 contains a DAX measure that sums the Sales column.
You need to create a report that will contain the visual shown in the following exhibit.
The solution must NOT require additional DAX measures.
Which type of visual should you use?
A. ribbon chart
B. line chart
C. 100% stacked area chart
D. area chart
Show Answer
Correct Answer: C
Explanation: Use a 100% stacked area chart. It shows each category’s share of total Sales by quarter, with the vertical axis normalized to 0%–100%. The visual calculates the proportions, so no additional DAX measure is needed.
$19
Get all 371 questions with detailed answers and explanations
Instant download HTML + PDF delivered the moment payment clears.
Secure Stripe checkout we never see or store your card details.
7-day refund if files are defective see our refund policy.