You have a Power BI semantic model named Model1 that runs in Import storage mode.
You need to reduce the size of Model1.
Which two actions should you perform? Each correct answer presents a complete solution.
NOTE: Each correct selection is worth one point.
A. Summarize the detail data.
B. Upgrade to Power BI premium.
C. Implement row-level security (RLS).
D. Optimize the column data types.
E. Change the active relationships between tables to inactive relationships.
Show Answer
Correct Answer: A, D
Explanation: For Import mode semantic models, reducing stored data is the primary way to reduce model size. Summarizing detail data reduces the number of rows that must be imported and stored. Optimizing column data types improves VertiPaq compression and reduces memory usage. Upgrading to Premium does not reduce model size, RLS affects data access rather than storage, and changing active relationships to inactive does not materially reduce the model's size.
Question 74
You have a Power BI semantic model named Model1 that runs in Import storage mode.
You need to reduce the size of Model1. The solution must NOT increase report query response times.
What should you do?
A. Remove unnecessary columns.
B. Unpivot unnecessary columns.
C. Rename unnecessary columns.
D. Change Model1 to DirectQuery storage mode.
Show Answer
Correct Answer: A
Explanation: Removing unnecessary columns reduces the imported model size by eliminating data that VertiPaq must store and compress. This is a recommended data reduction technique and does not increase report query response times when the removed columns are not used. Unpivoting typically increases row count, renaming columns does not affect storage, and switching to DirectQuery reduces imported storage but can increase query response times.
Question 75
HOTSPOT
-
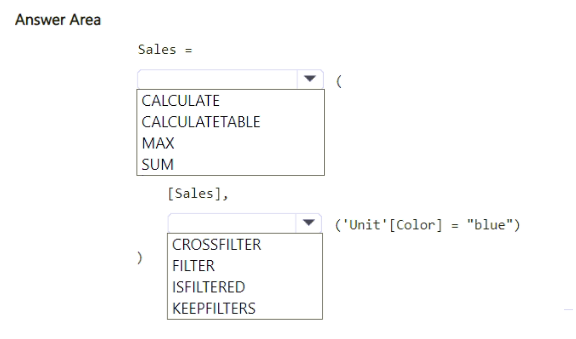
You have a Power BI semantic model named Model1.
You need to create a measure that will display the sales result for all blue units. The solution must maintain the existing filter context.
How should you complete the DAX expression? To answer, select the appropriate options in the answer area.
NOTE: Each correct selection is worth one point.
Show Answer
Correct Answer: CALCULATE
KEEPFILTERS
Explanation: Use CALCULATE to evaluate the existing [Sales] measure in a modified filter context. Wrap the color filter with KEEPFILTERS so the Blue filter is added to the current filter context instead of replacing it.
Question 77
You have a Power BI semantic model that contains a table named Table1. Table1 contains the following columns:
• WebsiteName
• URL
You need to create a report named Report1 that will contain a table visual. The solution must meet the following requirements:
• Display the website name.
• Enable users to navigate to the website's URL by selecting the website name.
What should you use?
A. data categories
B. Conditional Formatting
C. inline hierarchy labels
D. URL icons
Show Answer
Correct Answer: B
Explanation: To display the WebsiteName while navigating to a different column containing the URL, use conditional formatting with the Web URL option on the WebsiteName field, based on the URL column. Setting the URL column's data category to Web URL only identifies URL values as links; it does not make a different text column (WebsiteName) act as the hyperlink target.
Question 78
You use Power BI Desktop to import two tables named Customer and Contacts.
The Customer table contains the following columns:
• Customer_Name
• Customer ID
• Website
The Contacts table contains the following columns:
• Contact ID
• Contact Email
• Contact Name
• Customer Name
A web-based contact form is used to fill the Contacts table. The data is not sanitized.
You need to create a merge for the Customer and Contacts tables.
What should you do?
A. Disable fuzzy matching.
B. Enable fuzzy matching.
C. Set Join Kind to Left Outer.
Show Answer
Correct Answer: B
Explanation: The merge is based on customer names, and the Contacts table is populated from an unsanitized web form, so text values may contain typos, inconsistent capitalization, spacing, or minor variations. Enabling fuzzy matching allows Power Query to match similar text values instead of requiring exact string equality. Changing the join kind affects which rows are retained, not how text values are matched.
Question 79
Note: This question is part of a series of questions that present the same scenario. Each question in the series contains a unique solution that might meet the stated goals. Some question sets might have more than one correct solution, while others might not have a correct solution.
After you answer a question in this section, you will NOT be able to return to it. As a result, these questions will not appear in the review screen.
You have an on-premises data gateway.
You need to reduce the amount of data sent through the gateway by semantic models that run in Import storage mode.
Solution: You decrease the dashboard cache update frequency.
Does this meet the goal?
A. Yes
B. No
Show Answer
Correct Answer: B
Explanation: In Import storage mode, data passes through the on-premises data gateway during dataset (semantic model) refreshes. Decreasing the dashboard cache update frequency affects how often dashboard tiles are refreshed from the existing semantic model in the Power BI service, not the amount of source data transferred through the gateway. It therefore does not meet the stated goal.
Question 80
Note: This question is part of a series of questions that present the same scenario. Each question in the series contains a unique solution that might meet the stated goals. Some question sets might have more than one correct solution, while others might not have a correct solution.
After you answer a question in this section, you will NOT be able to return to it. As a result, these questions will not appear in the review screen.
You have an on-premises data gateway.
You need to reduce the amount of data sent through the gateway by semantic models that run in Import storage mode.
Solution: You create aggregations to summarize results.
Does this meet the goal?
A. Yes
B. No
Show Answer
Correct Answer: B
Explanation: For semantic models in Import mode, the on-premises data gateway is used during refresh to transfer data from the source into the model. Creating aggregations in the semantic model improves query performance but does not reduce the amount of data transferred during an import refresh because the detailed data still must be imported. To reduce gateway traffic, you would filter, summarize, or otherwise reduce data at the source or during query folding before import.
Question 81
You have a Power BI semantic model that contains two queries.
You discover that a report based on the model has performance issues.
You plan to use Power Query to reduce the data loaded to the model.
Which two actions should you perform? Each correct answer presents part of the solution.
NOTE: Each correct answer is worth one point.
A. Apply group by and summarize techniques.
B. Combine the queries by using Append.
C. Remove unnecessary columns and rows.
D. Combine the queries by using Merge.
E. Create a new query group.
Show Answer
Correct Answer: A, C
Explanation: To reduce the amount of data loaded into a Power BI semantic model, use Power Query to aggregate data where detailed granularity is unnecessary (Group By/Summarize) and remove unnecessary columns and rows before loading. Appending or merging queries changes data shape but does not inherently reduce the volume of data loaded, and query groups are only for organization.
Question 82
Note: This question is part of a series of questions that present the same scenario. Each question in the series contains a unique solution that might meet the stated goals. Some question sets might have more than one correct solution, while others might not have a correct solution.
After you answer a question in this section, you will NOT be able to return to it. As a result, these questions will not appear in the review screen.
You have an on-premises data gateway.
You need to reduce the amount of data sent through the gateway by semantic models that run in import storage mode.
Solution: You increase Automatic page refresh intervals.
Does this meet the goal?
A. Yes
B. No
Show Answer
Correct Answer: B
Explanation: Automatic page refresh is a report feature intended for DirectQuery and some live connection scenarios, not Import mode semantic models. For Import mode, gateway traffic is driven by dataset refresh operations, so increasing automatic page refresh intervals does not reduce data sent through the on-premises data gateway.
Question 83
Note: This question is part of a series of questions that present the same scenario. Each question in the series contains a unique solution that might meet the stated goals. Some question sets might have more than one correct solution, while others might not have a correct solution.
After you answer a question in this section, you will NOT be able to return to it. As a result, these questions will not appear in the review screen.
You have an on-premises data gateway.
You need to reduce the amount of data sent through the gateway by semantic models that run in import storage mode.
Solution: You configure incremental refresh.
Does this meet the goal?
A. Yes
B. No
Show Answer
Correct Answer: A
Explanation: Yes. Incremental refresh for Import-mode semantic models refreshes only new or changed partitions (based on the configured date/time policy) instead of re-importing the entire dataset. This reduces the volume of data retrieved from the on-premises data source and therefore the amount of data sent through the on-premises data gateway during refresh.
$19
Get all 371 questions with detailed answers and explanations
Instant download HTML + PDF delivered the moment payment clears.
Secure Stripe checkout we never see or store your card details.
7-day refund if files are defective see our refund policy.