HOTSPOT
-
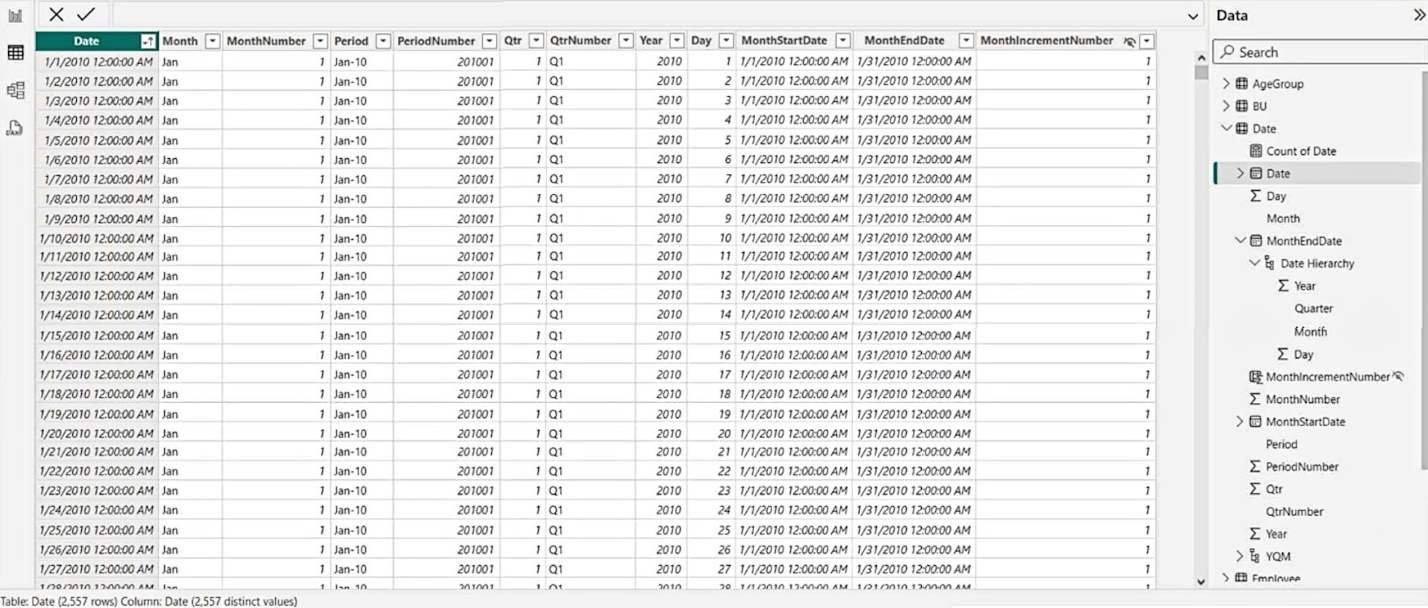
You use Microsoft Power BI Desktop to review the data shown in the following exhibit.
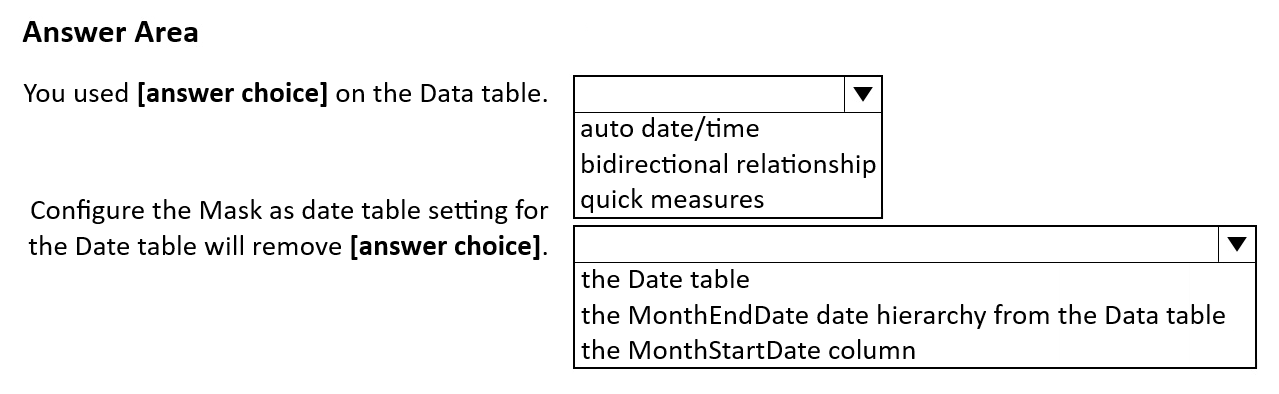
Use the drop-down menus to select the answer choice that completes each statement based on the information presented in the graphic.
NOTE: Each correct selection is worth one point.
Show Answer
Correct Answer: auto date/time
the MonthEndDate date hierarchy from the Data table
Explanation: The visible date hierarchy on a date column indicates Auto Date/Time. Marking a table as the official Date table disables the auto-generated date hierarchies for its date columns, removing the generated hierarchy (such as MonthEndDate), not the table or the column itself.
Question 64
You have a Power BI tenant that contains a workspace named WS1. WS1 contains the following items:
• A semantic model named SM1.
• A report named RPT1 that is connected to SM1.
• A report named RPT2 that is connected to SM1.
• A report named RPT3 that is connected to SM1.
• A dashboard named DB1 that contains content from RPT1 and RPT2.
You need to grant workspace access to a group named Group1. The solution must meet the following requirements:
• Group1 must be able to view RPT1, RPT2, and DB1.
• Group1 must be prevented from viewing RPT3.
• Group1 must be prevented from creating new reports and dashboards by using SM1.
• Group1 must be prevented from sharing the reports and dashboards to other users.
• Administrative effort must be minimized.
What should you do?
A. Publish an app.
B. Assign Group1 the Viewer role for WS1.
C. Store PBIX files in a shared folder in Microsoft OneDrive.
D. Share each item individually.
Show Answer
Correct Answer: A
Explanation: Publishing a Power BI app lets you include only RPT1, RPT2, and DB1 while excluding RPT3. App audiences receive read-only access to the published content, so they cannot build new reports from the semantic model or share workspace content. Assigning the Viewer role would expose all workspace items, including RPT3. Sharing items individually requires more administration, and storing PBIX files in OneDrive does not satisfy the Power BI access-control requirements for reports and dashboards.
Question 65
HOTSPOT
-
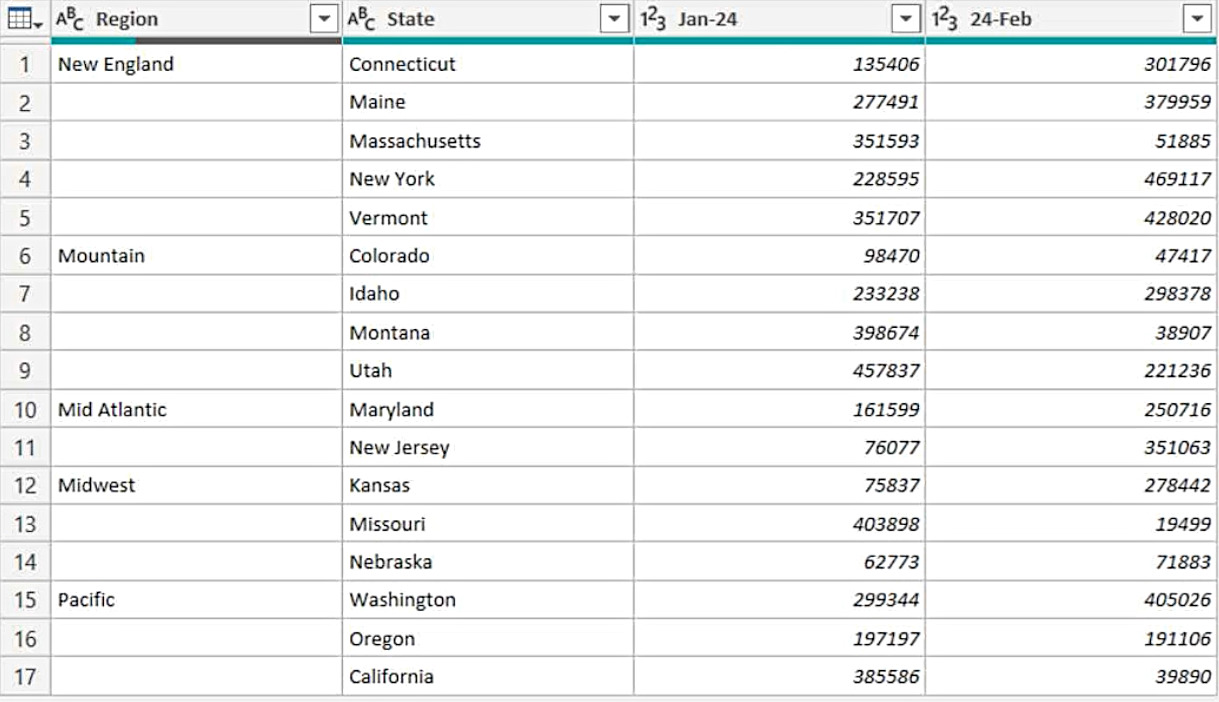
You use Power Query Editor to review the query shown in the following exhibit.
Each Region value appears only on the row where it first occurred. Each subsequent occurrence of the Region value is blank.
You need to ensure that every row contains the correct non-blank value. The solution must minimize development effort.
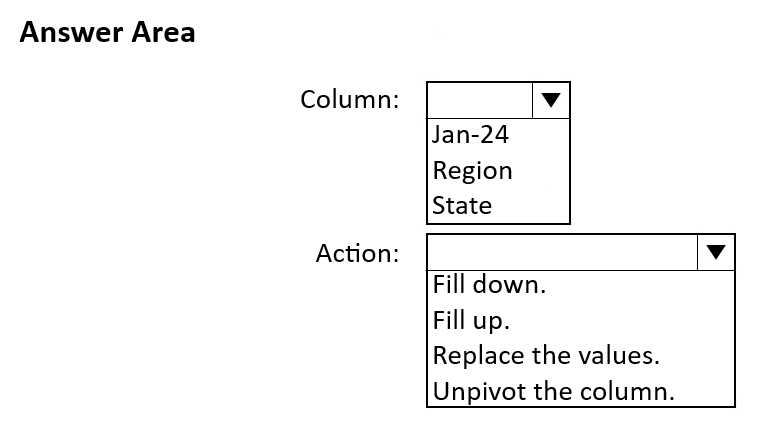
Which column should you select, and which action should you perform on the column? To answer, select the appropriate options in the answer area.
NOTE: Each correct selection is worth one point.
Show Answer
Correct Answer: Column: Region
Action: Fill down
Explanation: The Region column has blank cells after the first occurrence of each group. In Power Query, Fill down propagates the last non-blank value into subsequent blank rows, which is the minimal-effort solution.
Question 66
You are creating a new semantic model in Microsoft Power BI Desktop.
You connect to a recently used data source and receive an error message indicating that the password is expired.
You need to update the credentials for the data source.
What should you do?
A. From Data Source settings, select the data source, and then select Edit Permissions.
B. From Options, select Data Load, and then select Clear Cache.
C. From Power Query Editor, select Refresh Preview.
D. From the Modeling tab, select Manage Roles, and then add a role.
Show Answer
Correct Answer: A
Explanation: An expired password means the stored credentials for the data source must be updated. In Power BI Desktop, open Data source settings, select the data source, choose Edit Permissions, and update the credentials. Clearing cache does not change credentials, Refresh Preview will continue to fail with invalid credentials, and Manage Roles is unrelated to data source authentication.
Question 67
You have a Microsoft Power BI Desktop report named Report1 that uses an Azure SQL database as a data source.
A user named User1 plans to create a report by using the same data source as Report1.
You need to simplify the connection to the data source for User1.
Which type of file should you create?
A. PBIDS
B. XLSX
C. PBIT
D. PBIX
Show Answer
Correct Answer: A
Explanation: A .PBIDS (Power BI Data Source) file is designed to store connection information for a data source and launch Power BI Desktop with the connection details preconfigured, simplifying access to the same Azure SQL database. A .PBIT is a report template, .PBIX is a full report, and .XLSX is an Excel workbook.
Question 68
You have a Power BI semantic model named Model1 that contains sales data.
You need to ensure that Model1 is refreshed on the first day of each month to include last month’s sales data.
What should you configure?
A. a scheduled refresh
B. an incremental refresh
C. a Microsoft Power Automate flow
D. an on-premises data gateway
Show Answer
Correct Answer: C
Explanation: Power BI scheduled refresh supports daily or weekly schedules, not a native monthly schedule for semantic models. Incremental refresh controls what data is refreshed, not when. An on-premises data gateway only enables connectivity. To trigger a refresh specifically on the first day of each month, configure a Power Automate flow with a monthly recurrence that calls the semantic model refresh.
Question 69
You have a Power BI report that contains a bar chart. The bar chart displays sales by country.
You need to ensure that a summary of the data shown on the bar chart is accessible by using a screen reader.
What should you configure on the bar chart?
A. conditional formatting
B. alt text
C. the tab order
D. the layer order
Show Answer
Correct Answer: B
Explanation: Configure the visual's alt text. In Power BI, alt text provides a textual description or summary of a visual that screen readers can read, making the chart's content accessible. Tab order affects keyboard navigation, while layer order and conditional formatting do not provide screen-reader summaries.
Question 70
You create a Power BI workspace named Workspace1.
You publish a semantic model and a report to Workspace1.
You need to configure Workspace1 to meet the following requirements:
• Provide access to a group named Sales.
• Ensure that Sales can invite other users to Workspace1.
• Follow the principle of least privilege.
Which role should you assign to Sales?
A. Contributor
B. Member
C. Admin
D. Viewer
Show Answer
Correct Answer: B
Explanation: The Member role is the least-privileged workspace role that can invite other users to the workspace. Contributor can create and edit content but cannot manage workspace access by inviting users. Viewer cannot invite users, and Admin has broader permissions than required, violating least privilege.
Question 71
DRAG DROP
-
You have a Power BI semantic model that contains a table.
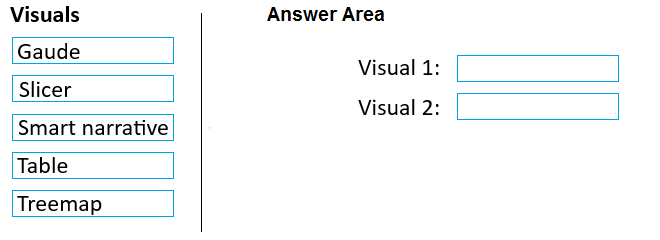
You need to create a Power BI report page that contains two visuals that meet the following requirements:
• Visual 1: Displays the distribution of hierarchical data
• Visual 2: Search and then filter by values
Which type should you choose for each visual? To answer, drag the appropriate visual types to the correct visuals. Each visual type may be used once, more than once, or not at all. You may need to drag the split bar between panes or scroll to view content.
NOTE: Each correct selection is worth one point.
Explanation: A Treemap is used to visualize the distribution of hierarchical data. A Slicer provides interactive filtering and includes search capability to find and filter by values.
Question 72
HOTSPOT -
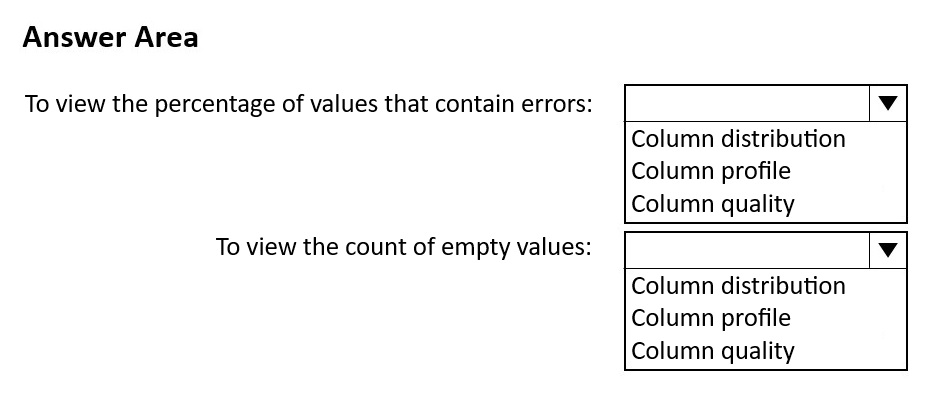
You use Power Query Editor to review a query that contains a column named Country.
You need to view the following information in the Data preview view for the Country column:
• The percentage of values that contain errors.
• The count of empty values.
What should you enable? To answer, select the appropriate options in the answer area.
NOTE: Each correct selection is worth one point.
Show Answer
Correct Answer: Column quality
Column profile
Explanation: Column quality displays the percentage of valid, error, and empty values. Column profile provides detailed statistics, including the count of empty (null) values for the selected column.
$19
Get all 371 questions with detailed answers and explanations
Instant download HTML + PDF delivered the moment payment clears.
Secure Stripe checkout we never see or store your card details.
7-day refund if files are defective see our refund policy.