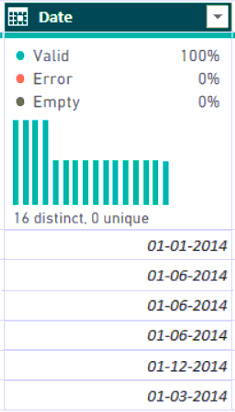
You use Power Query Editor to preview a column named Date as shown in the following exhibit.
You need to change the Date column to contain only the year. The solution must minimize administrative effort.
What should you do?
A. Split the column by delimiter.
B. Split the column by number of characters.
C. Extract the text after the delimiter.
D. Transform the column to contain only the year.
Show Answer
Correct Answer: D
Explanation: Select the Date column and use Transform > Date > Year. This directly extracts the year from date values and requires fewer steps than splitting or extracting text.
Question 14
You attempt to connect Power BI Desktop to a Cassandra database.
From the Get Data connector list, you discover that there is no specific connector for the Cassandra database.
You need to select an alternate data connector that will connect to the database.
Which type of connector should you choose?
A. Microsoft SQL Server database
B. ODBC
C. OLE DB
D. OData
Show Answer
Correct Answer: B
Explanation: Choose ODBC. Power BI can use an ODBC driver to connect to databases without a dedicated connector, and Cassandra has third-party ODBC drivers. The other options are for SQL Server, OLE DB providers, or OData services rather than a generic Cassandra connection.
Question 14
HOTSPOT
-
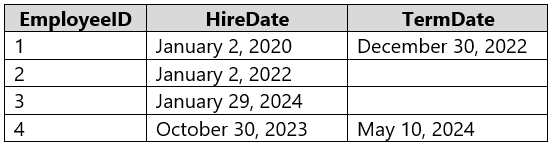
You have a Power BI semantic model that contains the following table named Employees.
An employee is considered active if the TermDate column for that employee contains no value.
You need to create a DAX measure that will count the number of active employees.
How should you complete the DAX expression? To answer, select the appropriate options in the answer area.
NOTE: Each correct selection is worth one point.
Show Answer
Correct Answer: CALCULATE
ISBLANK
Explanation: Use CALCULATE to modify the filter context and count only rows where Employees[TermDate] is blank. ISBLANK identifies active employees because a blank TermDate means they have not been terminated.
Question 15
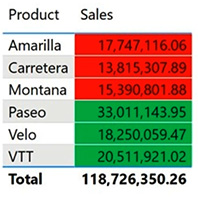
You have a Power BI report that contains the visual shown in the following exhibit.
You need to make the visual more accessible to users who have color vision deficiency.
What should you do?
A. Change the font color of values in the Sales column to white.
B. Change the red background color to orange.
C. Add additional measures to the table values.
D. Add icons to represent the sales status of each product.
Show Answer
Correct Answer: D
Explanation: Add icons to indicate each product’s sales status. Icons provide a visual cue beyond the red/green background colors, so users with color vision deficiency can interpret the status without relying on color alone.
Question 16
HOTSPOT
-
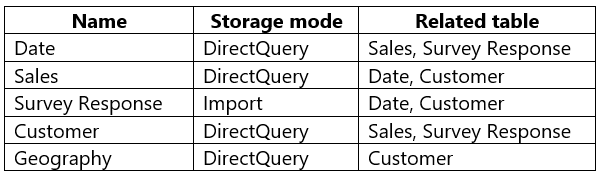
You have a Power BI semantic model that contains the following tables.
All the tables use the same data source.
You need to reduce the number of limited relationships in the model by changing the storage mode of certain tables. The solution must NOT affect the latency of the data.
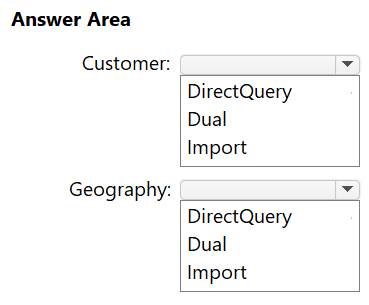
Which storage mode should you select for the Customer and Geography tables? To answer, select the appropriate options in the answer area.
NOTE: Each correct selection is worth one point.
Show Answer
Correct Answer: Customer: Dual
Geography: Dual
Explanation: Dual storage mode for shared dimension tables allows them to act as Import with imported tables and DirectQuery with DirectQuery tables, reducing limited relationships while preserving DirectQuery latency for real-time data.
Question 16
Note: This question is part of a series of questions that present the same scenario. Each question in the series contains a unique solution that might meet the stated goals. Some question sets might have more than one correct solution, while others might not have a correct solution.
After you answer a question in this section, you will NOT be able to return to it. As a result, these questions will not appear in the review screen.
You have a Power BI report that imports a date table and a sales table from an Azure SQL database data source. The sales table has the following date foreign keys:
✑ Due Date
✑ Order Date
✑ Delivery Date
You need to support the analysis of sales over time based on all the date foreign keys.
Solution: From Power Query Editor, you rename the date query as Due Date. You reference the Due Date query twice to make the queries for Order Date and
Delivery Date.
Does this meet the goal?
A. Yes
B. No
Show Answer
Correct Answer: A
Explanation: Yes. Referencing the date query twice creates separate date-table queries for Due Date, Order Date, and Delivery Date. These role-playing date tables can each be related to the corresponding sales date foreign key, allowing sales analysis over time for all three dates.
Question 16
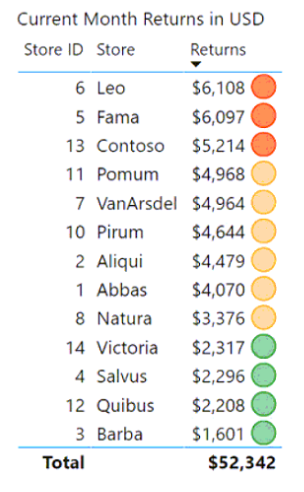
You have a Power BI report that contains the table shown in the following exhibit.
The table contains conditional formatting that shows which stores are above, near, or below the monthly quota for returns.
You need to ensure that the table is accessible to consumers of reports who have color vision deficiency.
What should you do?
A. Move the conditional formatting icons to a tooltip report.
B. Add alt text that lists the values in the table.
C. Change the icons to use a different shape for each color.
D. Remove the icons and use red, yellow, and green background colors instead.
Show Answer
Correct Answer: C
Explanation: Use a different icon shape for each status so the above, near, and below quota categories can be distinguished without relying on color alone. Red, yellow, and green backgrounds would still depend on color perception.
Question 17
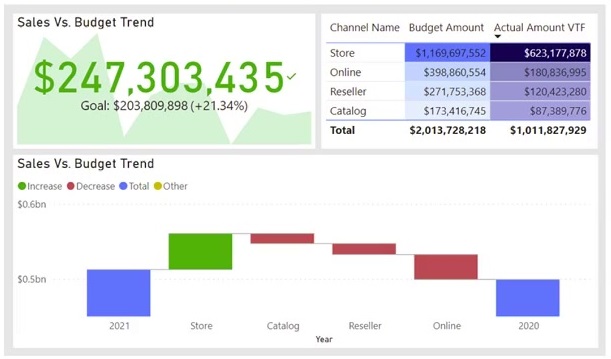
You are configuring a Power BI report for accessibility as shown in the following table.
You need to change the default colors of all three visuals to make the report more accessible to users who have color vision deficiency.
Which two settings should you configure in the Customize theme window? Each correct answer presents part of the solution.
NOTE: Each correct selection is worth one point.
A. First-level elements colors
B. Theme colors
C. Divergent colors
D. Sentiment colors
Show Answer
Correct Answer: C, D
Explanation: Configure Divergent colors for the table’s value-based color gradient, and Sentiment colors for the KPI and waterfall chart’s positive/negative indicators. Choose colors that remain distinguishable for users with color vision deficiency.
Sources:
https://learn.microsoft.com/en-us/power-bi/create-reports/desktop-report-themes
Question 18
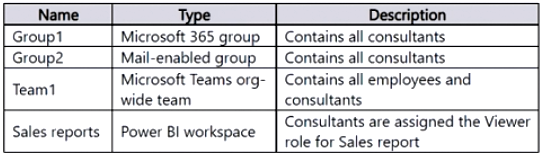
You have a Microsoft 365 subscription that contains the resources shown in the following table.
You create a new dashboard that uses row-level security (RLS) filters. You define a new role named Consultants.
To which resource can you assign the Consultants role?
A. Group2
B. Team1
C. Sales reports
D. Group1
Show Answer
Correct Answer: A
Explanation: Assign the Consultants RLS role to Group2. Mail-enabled groups are supported as members of Power BI RLS roles. Microsoft 365 groups aren’t supported; Team1 is a Teams team, and Sales reports is a workspace rather than a group to add to the RLS role.
Question 18
HOTSPOT
-
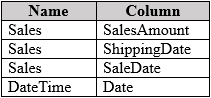
You have a semantic model named Model1 that contains the following tables.
There is an active relationship between SaleDate and Date.
There is an inactive relationship between ShippingDate and Date.
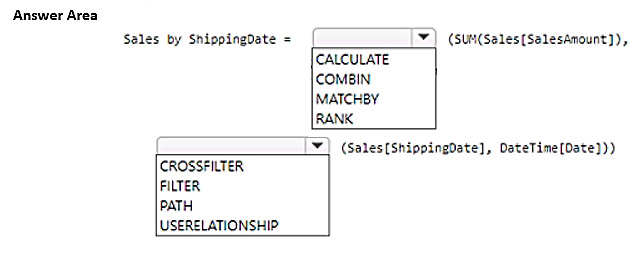
You need to create a new measure that will display the total amount of sales and support slicing by ShippingDate.
How should you complete the DAX expression? To answer, select the appropriate options in the answer area.
NOTE: Each correct selection is worth one point.
Show Answer
Correct Answer: CALCULATE
USERELATIONSHIP
Explanation: Use CALCULATE to modify the filter context and USERELATIONSHIP(Sales[ShippingDate], DateTime[Date]) to temporarily activate the inactive ShippingDate relationship so the measure slices by ShippingDate.
$19
Get all 371 questions with detailed answers and explanations
Instant download HTML + PDF delivered the moment payment clears.
Secure Stripe checkout we never see or store your card details.
7-day refund if files are defective see our refund policy.