You have a Microsoft Excel file in a Microsoft OneDrive folder.
The file must be imported to a Power BI semantic model.
You need to ensure that the semantic model can be refreshed in PowerBi.com.
Which two connectors can you use to connect to the file? Each correct answer presents a complete solution.
NOTE: Each correct selection is worth one point.
A. Web
B. Excel Workbook
C. Folder
D. Text/CSV
E. SharePoint folder
Show Answer
Correct Answer: A, E
Explanation: To ensure scheduled refresh in the Power BI service without requiring an on-premises gateway, connect to the cloud-hosted OneDrive file using cloud-supported connectors. The Web connector can access the Excel file via its OneDrive/SharePoint URL, and the SharePoint Folder connector is designed for SharePoint Online, which underpins OneDrive for Business. The local Excel Workbook and Folder connectors typically reference local file access and are not the appropriate choice for this requirement; Text/CSV does not apply to an Excel file.
Question 109
HOTSPOT -
You have a Power BI semantic model that contains two tables as shown in the following exhibit.
Use the drop-down menus to select the answer choice that completes each statement based on the information presented in the graphic.
NOTE: Each correct selection is worth one point.
Show Answer
Correct Answer: Single
Delete the many-to-one relationship
Explanation: The active many-to-one relationship shows single-direction cross filtering. Only one active relationship can exist between the same two tables, so to make the many-to-many relationship active for bidirectional filtering and RLS, you must first remove (or otherwise deactivate) the existing active many-to-one relationship. Since 'make inactive' is not an option, 'delete the many-to-one relationship' is the correct choice.
Question 110
HOTSPOT -
You have a Power BI semantic model that contains a table named Opportunity.
The Opportunity table contains a column named Qualification. The Qualification column contains values between 0 and 1.
You need to build a new measure to score the opportunities on a scale of low. medium, and high.
How should you complete the DAX formula? To answer, select the appropriate options in the answer area.
NOTE: Each correct selection is worth one point.
Show Answer
Correct Answer: IF
HIGH
MEDIUM
Explanation: Use a nested IF: values < 0.5 are Low, values > 0.7 are High, otherwise Medium. IF.EAGER is unnecessary here because eager evaluation is not required.
Question 111
You have a Power BI semantic model that contains four queries named Query 1, Query2. Query3, and Query4.
Query1 loads customer data into the model and is referenced by the other three queries.
You discover that data refresh for the model is slow.
You need to improve the data refresh time. The solution must minimize costs.
What should you do?
A. Run the Table.buffer function in Query1.
B. Duplicate Query1 to all the other queries.
C. Reconfigure Query1 as a dataflow entity.
D. From the Power BI Admin portal, increase the Capacity settings.
Show Answer
Correct Answer: C
Explanation: The key issue is that a referenced query can be evaluated multiple times during refresh. Microsoft recommends moving the shared staging query into a dataflow so it is evaluated once and then reused by downstream queries, improving refresh performance and reducing repeated source access. Table.Buffer can sometimes help but is not a general recommendation for referenced-query refresh optimization, can increase memory usage, and may inhibit query folding. Duplicating the query increases redundant work, and increasing capacity raises costs.
Question 112
DRAG DROP
-
You use Power Query Editor to import three tables named Customers, Address, and Country.
In the source system, not every customer has a related address, but every address has a related country.
You need to merge all the tables into a single query. The solution must optimize query refresh performance.
Which type of join should you use for each merge operation? To answer, drag the appropriate join types to the correct operations. Each join type may be used once, more than once, or not at all. You may need to drag the split bar between panes or scroll to view content.
NOTE: Each correct selection is worth one point.
Show Answer
Correct Answer: Join Customers with Address: Left outer
Join Address with Country: Inner
Explanation: Use a Left Outer join to retain all customers even when some have no address. Use an Inner join between Address and Country because every address has a matching country, making it the most efficient choice without losing data.
Question 113
Note: This question is part of a series of questions that present the same scenario. Each question in the series contains a unique solution that might meet the stated goals. Some question sets might have more than one correct solution, while others might not have a correct solution.
After you answer a question in this section, you will NOT be able to return to it. As a result, these questions will not appear in the review screen.
You have a Power BI report that imports a date table and a sales table from an Azure SQL database data source. The sales table has the following date foreign keys:
• Due Date
• Order Date
• Delivery Date
You need to support the analysis of sales over time based on all the date foreign keys.
Solution: You create measures that use the USERELATIONSHIP DAX function to filter sales on the inactive relationship between the sales table and the date table.
Does this meet the goal?
A. Yes
B. No
Show Answer
Correct Answer: A
Explanation: Yes. In Power BI, only one relationship between the Sales table and the Date table can be active at a time. Additional relationships (such as Due Date and Delivery Date) are typically created as inactive. Measures can use the USERELATIONSHIP DAX function within CALCULATE to temporarily activate an inactive relationship, enabling analysis by the desired date key.
Question 114
HOTSPOT -
You have a Power BI semantic model that contains a table named Item. The Item table contains a column named Quantity.
You need to create a DAX query that meets the following requirements:
• The rank of items must be calculated according to the values in Quantity.
• Ranking must NOT be skipped if two or more items have the same value in Quantity.
• If an item is unfiltered, the total of Quantity must display a blank value.
How should you complete the DAX formula? To answer, select the appropriate options in the answer area.
NOTE: Each correct selection is worth one point.
Show Answer
Correct Answer: HASONEVALUE
DENSE
Explanation: Use IF(HASONEVALUE('Item'[Item]), RANKX(..., DENSE)) so totals or unfiltered item contexts return BLANK, and DENSE ranking avoids gaps when quantities are tied.
Question 115
Note: This question is part of a series of questions that present the same scenario. Each question in the series contains a unique solution that might meet the stated goals. Some question sets might have more than one correct solution, while others might not have a correct solution.
After you answer a question in this section, you will NOT be able to return to it. As a result, these questions will not appear in the review screen.
You have a data source that contains a column. The column contains case sensitive data.
You have a Power BI semantic model in DirectQuery mode.
You connect to the model and discover that it contains undefined values and errors.
You need to resolve the issue.
Solution: You change the semantic model mode.
Does this meet the goal?
A. Yes
B. No
Show Answer
Correct Answer: B
Explanation: Changing the semantic model mode by itself does not resolve undefined values or errors caused by case-sensitive data. While switching away from DirectQuery may enable additional transformation capabilities, the stated solution is only to change the model mode, not to clean or transform the data. Therefore, the proposed solution does not, by itself, meet the goal.
Question 117
You plan to use Power BI Desktop to create a bug tracking dashboard that will pull data from Analytics in Azure DevOps.
From Power BI Desktop, you need to configure a data connector to authenticate to Azure DevOps. The solution must meet the following requirements:
• Use Analytics views.
• Filter data from the cloud.
Which connector should you use?
A. OData queries
B. Azure DevOps (Boards only)
C. Azure DevOps Server (Boards only)
D. OData Feed
Show Answer
Correct Answer: B
Explanation: For Azure DevOps Services (cloud), the dedicated Azure DevOps (Boards only) connector is the connector designed to consume Analytics Views. It authenticates to Azure DevOps, lists available Analytics Views, and supports server-side filtering through those views. The Server connector is for on-premises Azure DevOps Server, while OData Feed is the generic connector used for raw Analytics OData endpoints rather than the dedicated Analytics Views experience. 'OData queries' is not a Power BI connector.
Sources:
https://www.middleway.eu/how-to-use-azure-devops-data-within-powerbi
https://learn.microsoft.com/en-us/azure/devops/report/powerbi/access-analytics-excel?view=azure-devops
Question 118
HOTSPOT
-
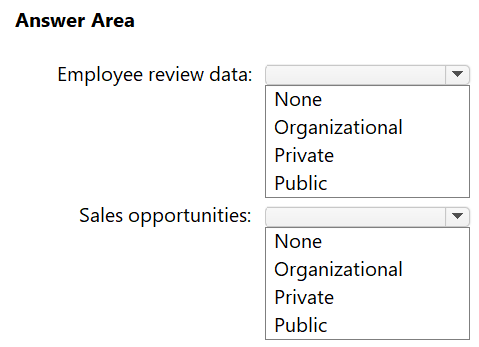
You have a Power BI semantic model that contains the data sources shown in the following table.
You need to configure the privacy level s of the data sources.
What should you configure for each data source? To answer, select the appropriate options in the answer area.
NOTE: Each correct answer is worth one point.
Explanation: Private prevents sensitive data from being folded into other data sources. Organizational allows sharing only within the organization and is appropriate for internal, less sensitive data.
$19
Get all 371 questions with detailed answers and explanations
Instant download HTML + PDF delivered the moment payment clears.
Secure Stripe checkout we never see or store your card details.
7-day refund if files are defective see our refund policy.